A bullish trajectory seems to be lying ahead for Infosys as the IT sector undergoes a breakout, according to derivative and technical data.
The Infosys stock formed a homing pigeon candlestick pattern in the first week of November, signalling a sequence of higher tops and higher bottoms on a daily scale, said Sudeep Shah, head of technical and derivative research at SBI Securities.
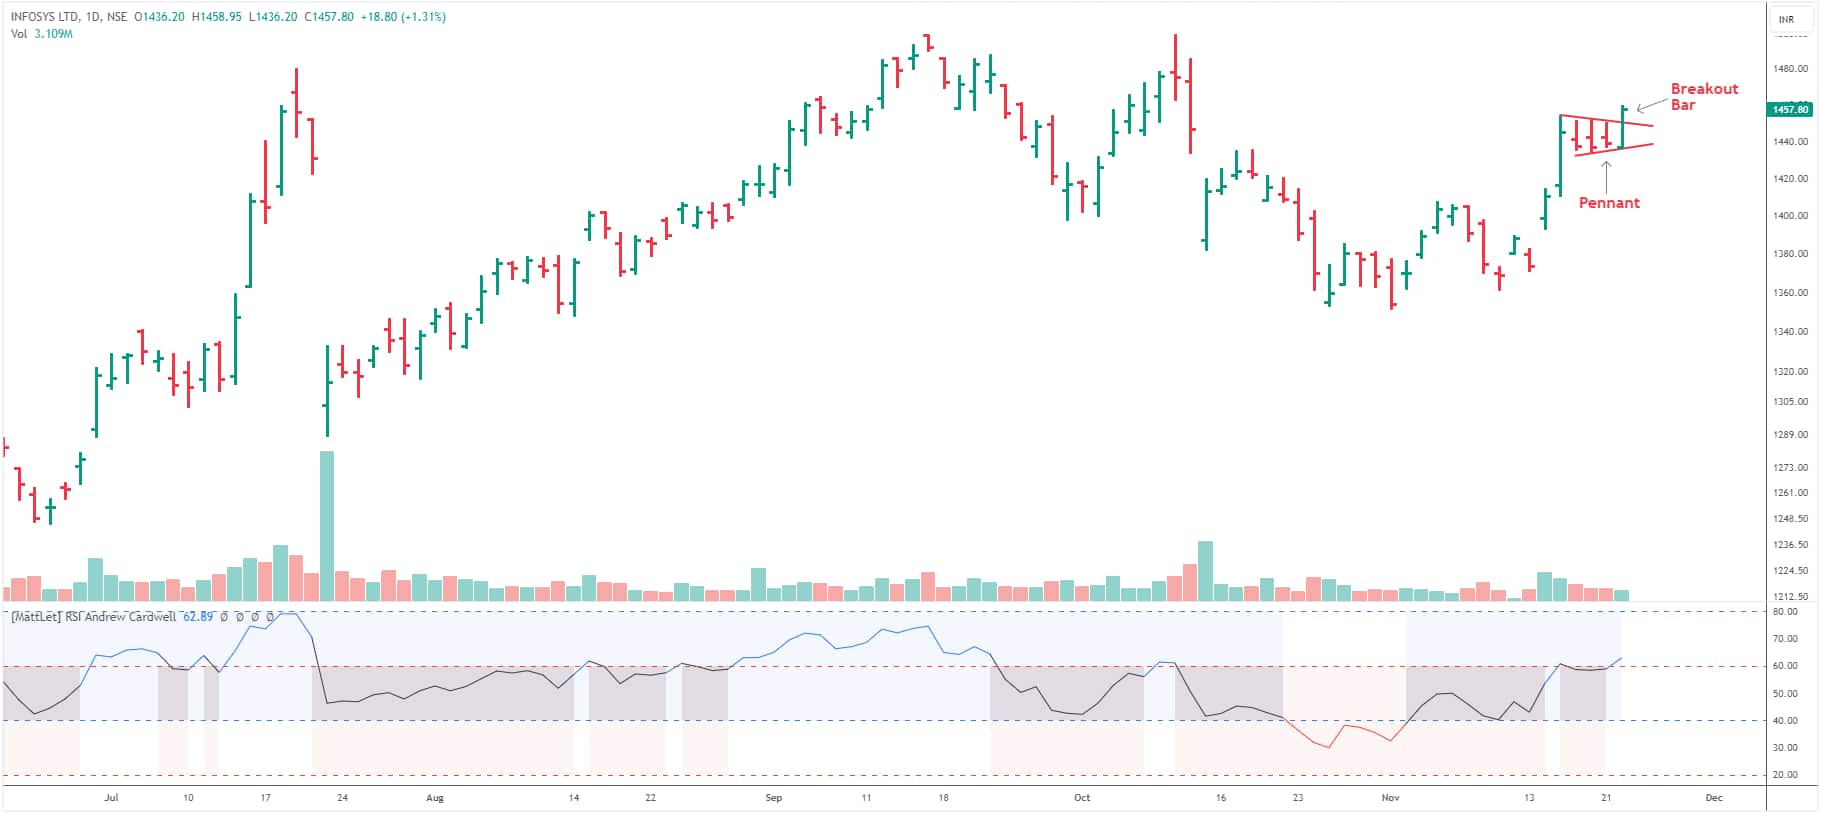 Technical chart of Infosys showing pennant breakout | Source: SBI Securities
“The stock reached a high of 1453 on November 16 and then saw a minor pullback, forming a bullish pennant pattern. During the pennant pattern formation, volume activity stayed below the 50-day average. The pennant is a short-term trend continuation pattern with conical bodies formed during a consolidation period,” Shah said.
On Wednesday, the stock broke out of the pennant pattern, indicating further bullish momentum. A significant bullish candle formed on the breakout day, reinforcing the strength of the breakout. The stock is trading above its short and long-term moving averages, both on a rising trajectory.
Discussing indicators, Shah noted that the 14-period daily RSI surged above the 60-mark for the first time since October 2023. The stochastic oscillator also suggests a bullish momentum as the fast stochastic is trading above its slow stochastic line.
On the derivatives front, the November future surged 1.28 percent, and the cumulative open interest (OI) of the current, next, and far series increased by nearly 5 percent, indicating a clear long build-up.
Advice for traders
With all these factors favouring the bulls, Shah advises traders to accumulate the stock in the 1,460-1,450 range with a stop-loss at Rs 1,420. On the upside, the stock is likely to test levels of Rs 1,520, followed by Rs 1,550 in the short term.