The market closed marginally in the red after bulls and bears fought through the week ended September 29, while the October series started off in the green with the Nifty50 rising 0.6 percent to 19,638 and forming a bullish harami pattern on the daily charts that hints at the possibility of further upside.
On the weekly timeframe, the index has formed a small-bodied bearish candlestick pattern with long lower shadow and small upper shadow, indicating volatility during the week. Overall, the index has still been in the range with 19,750-19,800 likely to act as a crucial resistance as breaking of the same can drive the Nifty50 towards 20,000 mark, whereas 19,500 is expected to be immediate support and 19,200 may be crucial support for the index, experts said.
“The Nifty50 defended the critical support levels of the 50-day SMA (simple moving average) and 61.8 percent retracement on a weekly basis. If prices continue to hold and break above the mentioned resistance, October could potentially turn out in the favour of the bulls,” Sameet Chavan, head of research for technical and derivatives at Angel One, said.
He advised participants to keep a close eye on global cues which will play a crucial role in this scenario.
On the downside, he feels the 19,500-19,550 range provided strong support and should be considered a pivotal level. “A breach below this range could trigger further declines, with levels around 19,300 marked by the 89-day EMA and the starting point of the recent rally at 19,200 possibly becoming the next downside target.”
Traders should closely track these levels and make their trading decisions accordingly, Sameet advised.
Amid all, mixed trends across sectors and buoyancy on the broader front are offering trading opportunities on both sides, Ajit Mishra, SVP – Technical Research at Religare Broking said. Hence, participants should continue with stock-specific approach, with focus on risk management, he advised.
Let’s take a look at the top 10 trading ideas from experts for the next three-four weeks. Returns are based on the September 29 closing prices.
Expert: Shrikant Chouhan, Head of Research (Retail) at Kotak Securities
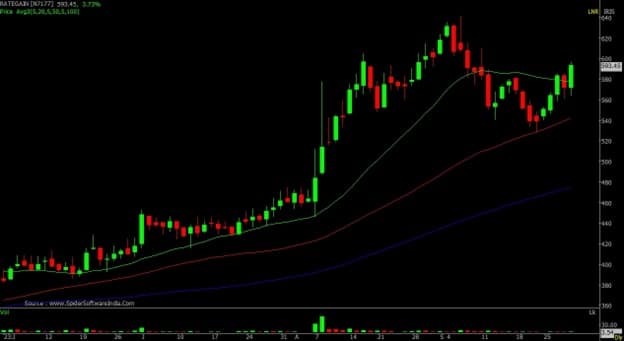
Rategain Travel Technologies: Buy | LTP: Rs 593.45 | Stop-Loss: Rs 560 | Targets: Rs 641-680 | Return: 14.6 percent
The stock showed a significant up-move between Rs 370 and Rs 641 before entering a correction phase. Nonetheless, it rebounded sharply after correcting to the 50-day SMA (simple moving average) and closed above the previous week’s highest point, signalling a trend reversal pattern.
Based on this pattern, the stock may reach its previous high of Rs 641 and potentially reach Rs 680. It would be prudent to buy at the current price and consider buying more during dips at Rs 575, while maintaining a stop-loss at Rs 560.
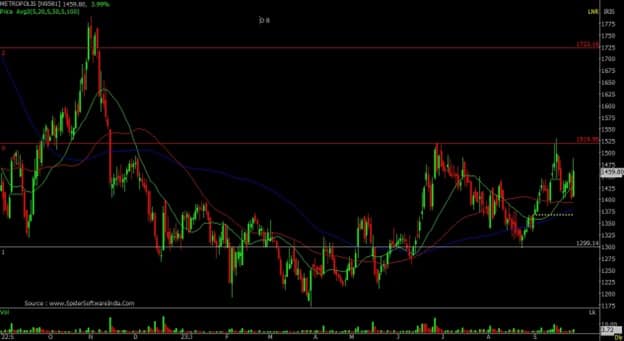
Metropolis Healthcare: Buy | LTP: Rs 1,459.8 | Stop-Loss: Rs 1,350 | Target: Rs 1,750-1,800 | Return: 23 percent
The stock is exhibiting bullish consolidation by forming a Cup and Handle formation, which is an encouraging sign. This is particularly noteworthy given the recent sluggish performance of the pathology stocks, which have now started to pick up.
If the stock manages to surpass the major resistance at Rs 1,530 soon, it will likely follow the bullish technical pattern and gradually climb upwards to around Rs 1,750-1,800 in the next few weeks.
Importantly, the stock is currently positioned above all significant averages, indicative of bullishness. Consequently, it is advisable to purchase at current levels and consider adding on any dips around Rs 1,450. It is prudent to set a stop-loss at Rs 1,350.
Expert: Viraj Vyas, CMT, Technical & Derivatives Analyst – Institutional Equity at Ashika Stock Broking
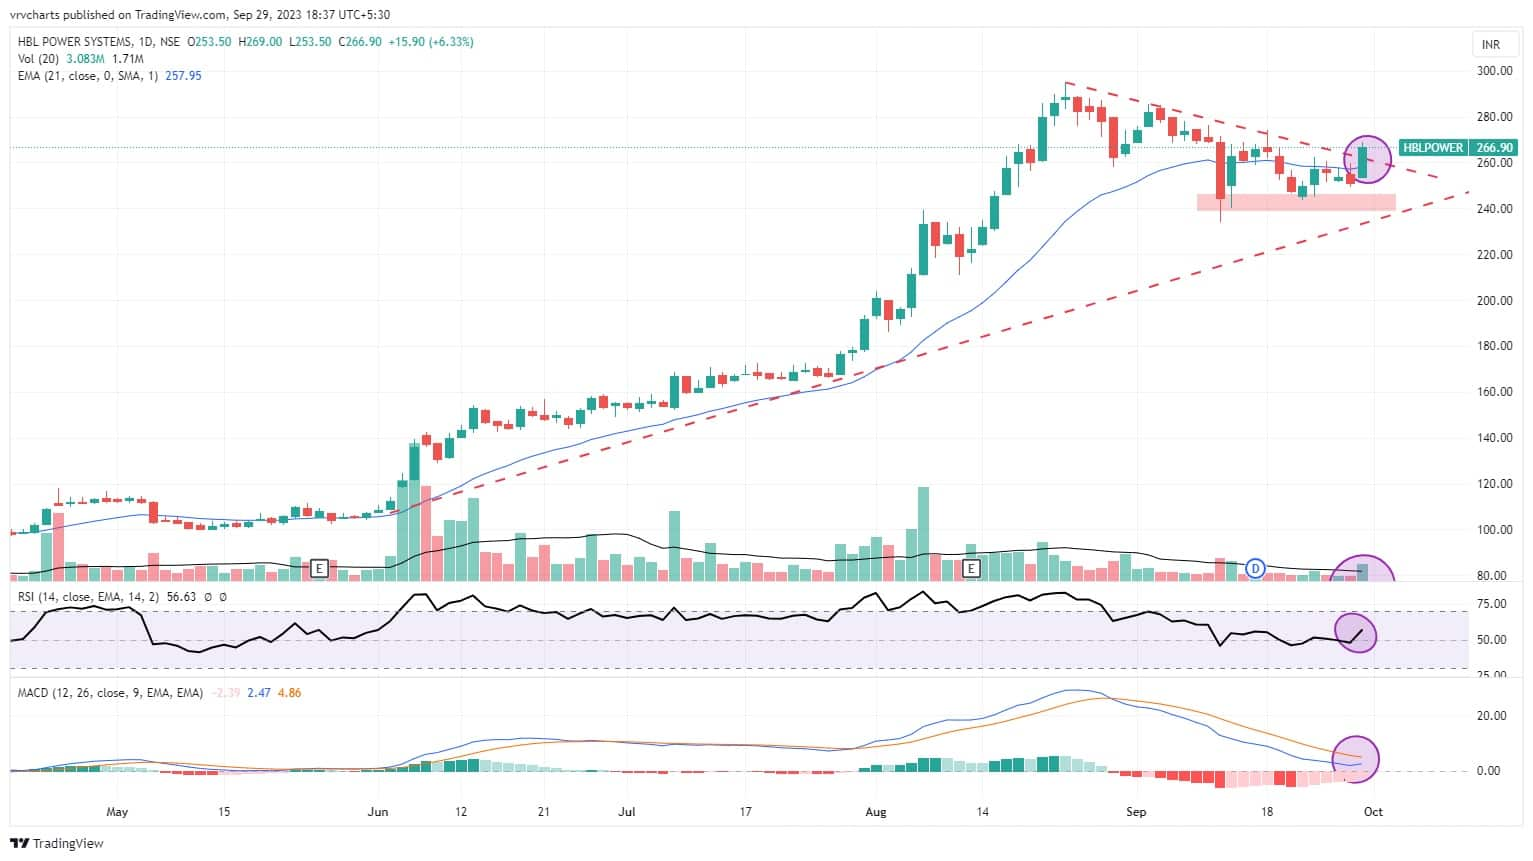
HBL Power Systems: Buy | LTP: Rs 267 | Stop-Loss: Rs 253 | Target: Rs 300 | Return: 12 percent
The stock has experienced a significant uptrend since June of this year. However, it entered a phase of correction, both in terms of time and price, starting from August 2023. Presently, it seems to be establishing a support level above the 21-day EMA (exponential moving average).
Notably, the stock recently exhibited a short-term trendline breakout, characterized by above-average trading volumes. Additionally, technical indicators such as the RSI (relative strength index) are on the rise, and the MACD (moving average convergence divergence) is showing potential for a bullish crossover. These signs suggest that the stock might be gearing up for a positive move.
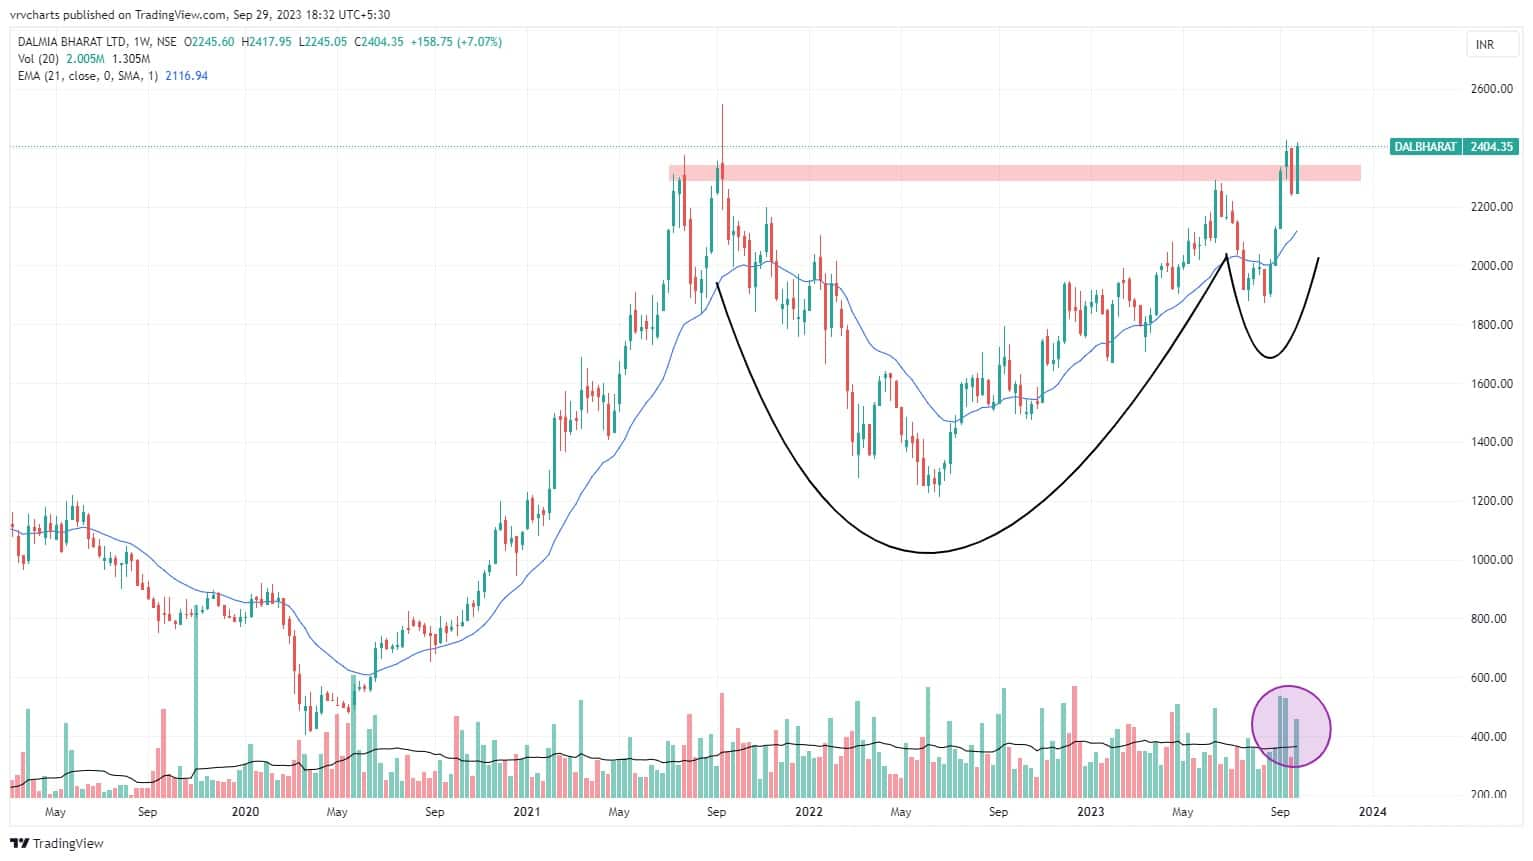
Dalmia Bharat: Buy | LTP: Rs 2,404 | Stop-Loss: Rs 2,280 | Target: Rs 2,700 | Return: 12 percent
After a robust and sustained upward trend from the lows of Rs 2,020, the stock has been in a phase of consolidation, both in terms of time and price.
Currently, it is trading near its all-time highs and seems to have formed a ‘Cup and Handle’ pattern. This pattern is the result of a two-year consolidation period, and the stock appears to have broken out from it with significant trading volumes. Sustaining above the previous resistance zone of Rs 2,380-2,370 indicates a favorable outlook for continued bullish momentum.
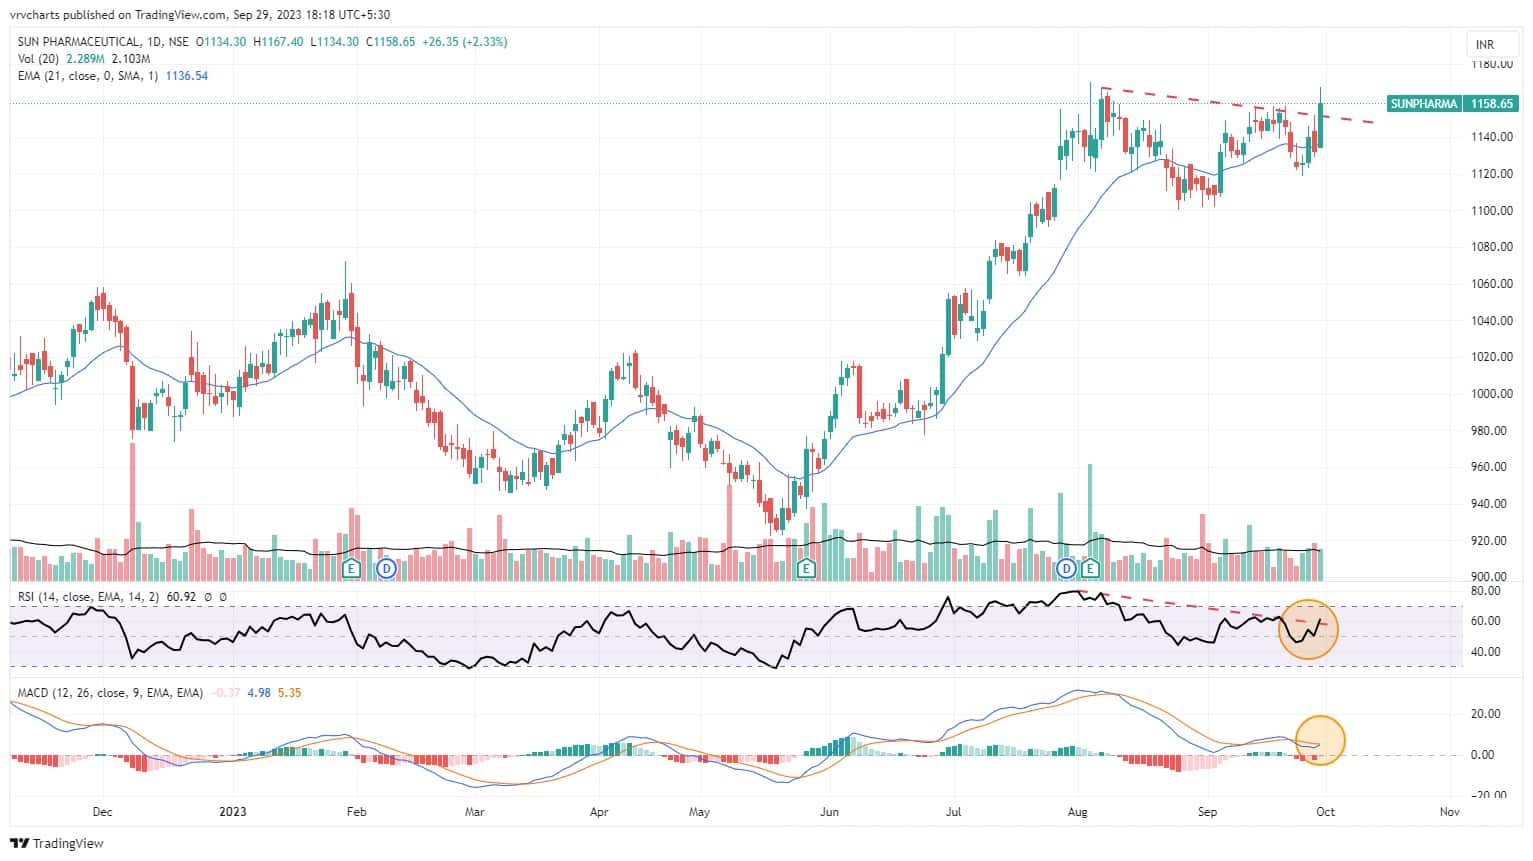
Sun Pharmaceutical Industries: Buy | LTP: Rs 1,158.65 | Stop-Loss: Rs 1,100 | Target: Rs 1,300 | Return: 12 percent
This pharmaceutical stock is heavyweight in the Pharma Index which appears to be staging a short-term breakout. However, it has recently surged and reached its previous all-time highs around Rs 1,200 levels.
The stock continues to climb, forming a pattern of higher highs and higher lows. In the daily chart, the stock has broken out of a short-term bearish trendline, indicating a potential shift in sentiment.
Additionally, the RSI is on the rise, and the MACD has generated a possible buy signal. With support around Rs 1,100 levels, the stock presents an attractive risk-reward ratio for traders and investors.
 Expert: Subash Gangadharan, senior technical & derivative analyst at HDFC Securities
Gujarat Alkalies and Chemicals: Buy | LTP: Rs 732.65 | Stop-Loss: Rs 680 | Target: Rs 830 | Return: 13 percent
Gujarat Alkalies showed relative strength last week. While the Nifty shed 0.18 percent last week, Gujarat Alkalies has gained a healthy 4.58 percent. In the process, the stock has closed above its recent trading range on the back of above average volumes, which augurs well for the uptrend to continue.
Technical indicators are giving positive signals as the stock is trading above the 20 and 50-day SMA (simple moving average). Momentum readings like the 14-week RSI too are in rising mode and not overbought, which implies potential for further upsides.
With the intermediate technical setup too looking attractive, we expect the stock to move up towards its previous intermediate highs in the coming weeks. Buy between Rs 728-732 levels. The stop-loss is at Rs 680 while target is at Rs 830.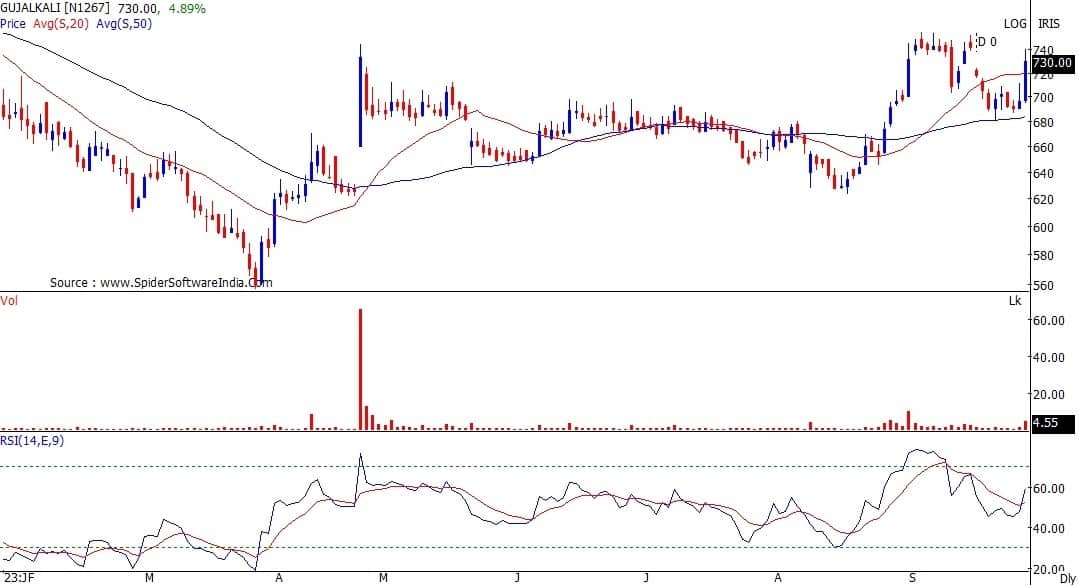
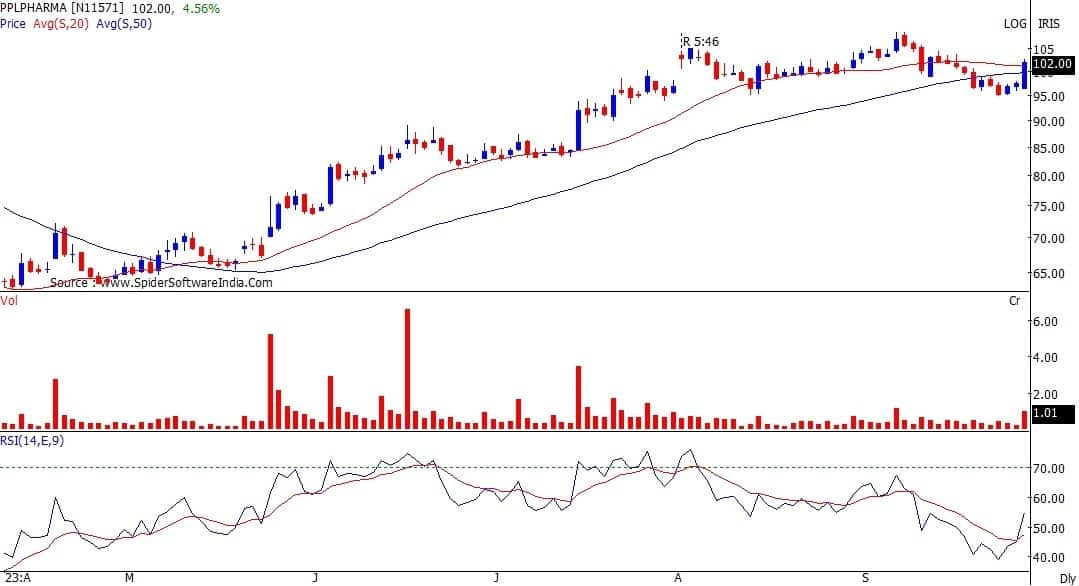
Piramal Pharma: Buy | LTP: Rs 102 | Stop-Loss: Rs 94 | Target: Rs 115 | Return: 13 percent
After correcting from an intermediate high of Rs 109 tested in September 2023, Piramal Pharma found support around Rs 95 levels early last week. These are strong supports as they also roughly coincide with previous intermediate lows.
The stock has since then bounced back and broken out of its recent trading range on the back of healthy volumes, indicating it is set to move higher in the coming weeks.
Technical indicators are giving positive signals as the stock is trading above the 20 and 50-day SMA. Momentum readings like the 14-day RSI too are in rising mode and not overbought, which implies potential for further upsides.
With the intermediate technical setup looking attractive too, we expect the stock to move up towards its previous intermediate highs in the coming weeks. Buy between Rs 101-103 levels. The stop-loss is at Rs 94 while target is at Rs 115.
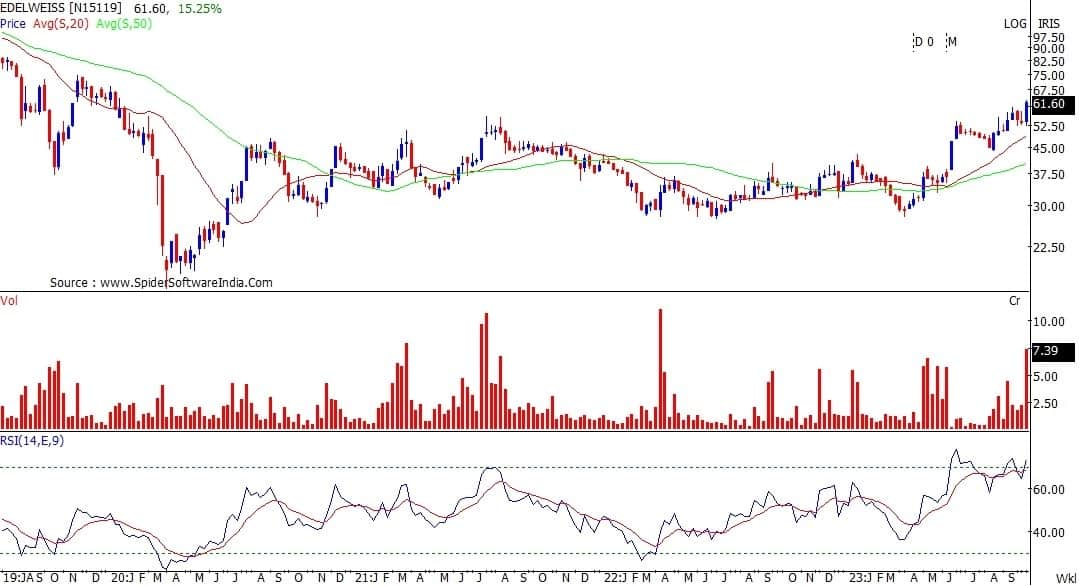
Edelweiss Financial Services: Buy | LTP: Rs 61.25 | Stop-Loss: Rs 51 | Target: Rs 90 | Return: 47 percent
Edelweiss is in a strong uptrend. The stock has been continuously making higher tops and higher bottoms over the last several months. In the process, the stock has broken out of a 3 year range on the back of huge volumes last week.
Technical indicators too are giving positive signals as the stock is trading above the 20 and 50 day SMA. Momentum readings like the 14-day RSI too are in rising mode and not overbought, which implies potential for further upsides.
With the intermediate technical setup too looking attractive, we expect the stock to move up towards its previous intermediate highs in the coming weeks. Buy between Rs 59-63 levels. Stop-loss is at Rs 51 while target is at Rs 90.
Expert: Mitesh Karwa, research analyst at Bonanza Portfolio
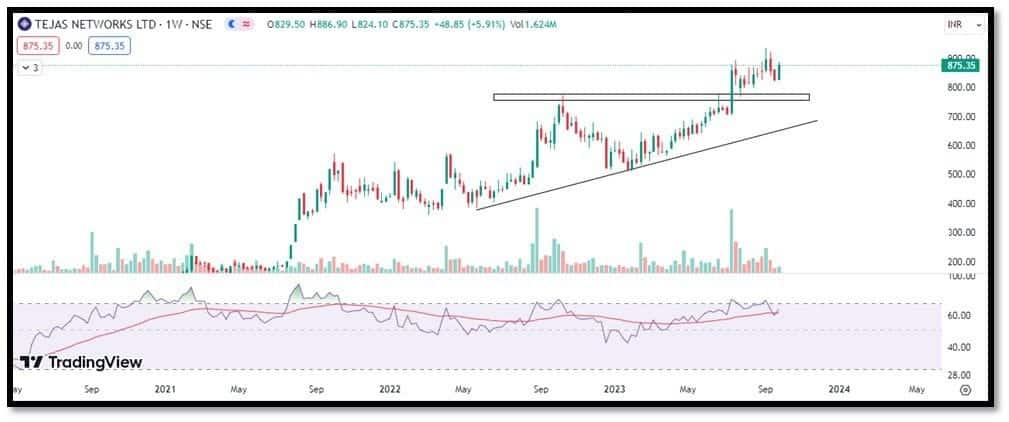
Tejas Networks: Buy | LTP: Rs 875 | Stop-Loss: Rs 830 | Target: Rs 965 | Return: 10 percent
Tejas Networks has seen breaking out of an Ascending triangle pattern on the weekly timeframe with a above average volumes. The stock is trading and sustaining above all its important EMAs which can be used as a confluence towards the bullish view.
On the indicator front, the Ichimoku Cloud is also suggesting a bullish move as the price is trading above the conversion line, base line and cloud. Momentum oscillator RSI (14) is at around 60 on the daily time frame indicating strength by sustaining above 50.
Observation of the above factors indicates that a bullish move in the stock is possible for target up to Rs 965. One can initiate a buy trade in between the range of Rs 875.35-872, with a stop-loss of Rs 830 on daily closing basis.
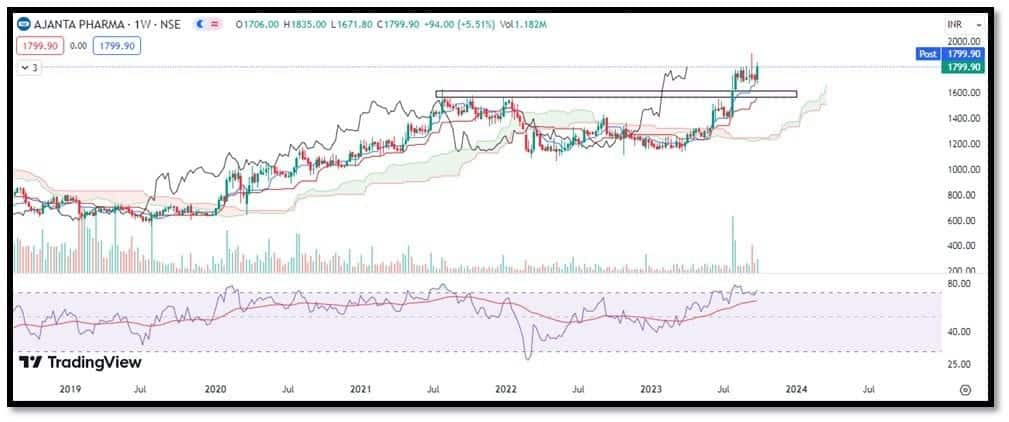
Ajanta Pharma: Buy | LTP: Rs 1,800 | Stop-Loss: Rs 1,708 | Target: Rs 1,982 | Return: 10 percent
Ajanta Pharma has seen breaking out of a resistance zone on the weekly timeframe with above average volumes and at the same time, the price is just consolidating above the previous supply zone. In addition, the stock is trading above important EMAs of 20/50/100/200 on the daily timeframe which indicates strength.
On the indicator front, momentum oscillator RSI (14) is at around 62 on the daily timeframe indicating strength by sustaining above 50. The Ichimoku cloud is also suggesting a bullish move.
Observation of the above factors indicates that a bullish move in Ajanta Pharma is possible for target up to Rs 1,982. One can initiate a buy trade in the range of Rs 1,799.90-1,795, with a stop-loss of Rs 1,708 on daily closing basis.