After the rally in the current month, the market saw some profit booking on September 18 as it seems to be in temporary overbought conditions. Hence, further consolidation can’t be ruled out with crucial support at 20,000-19,900 levels, while on the higher side, the index needs to take out 20,200 first to catch further upside towards the 20,500 mark, experts said.
The Nifty50 dropped 59 points to 20,133, and the BSE Sensex slipped 242 points to 67,597, while the Nifty Midcap 100 and Smallcap 100 indices were under pressure, falling 0.4 percent and half a percent, respectively.
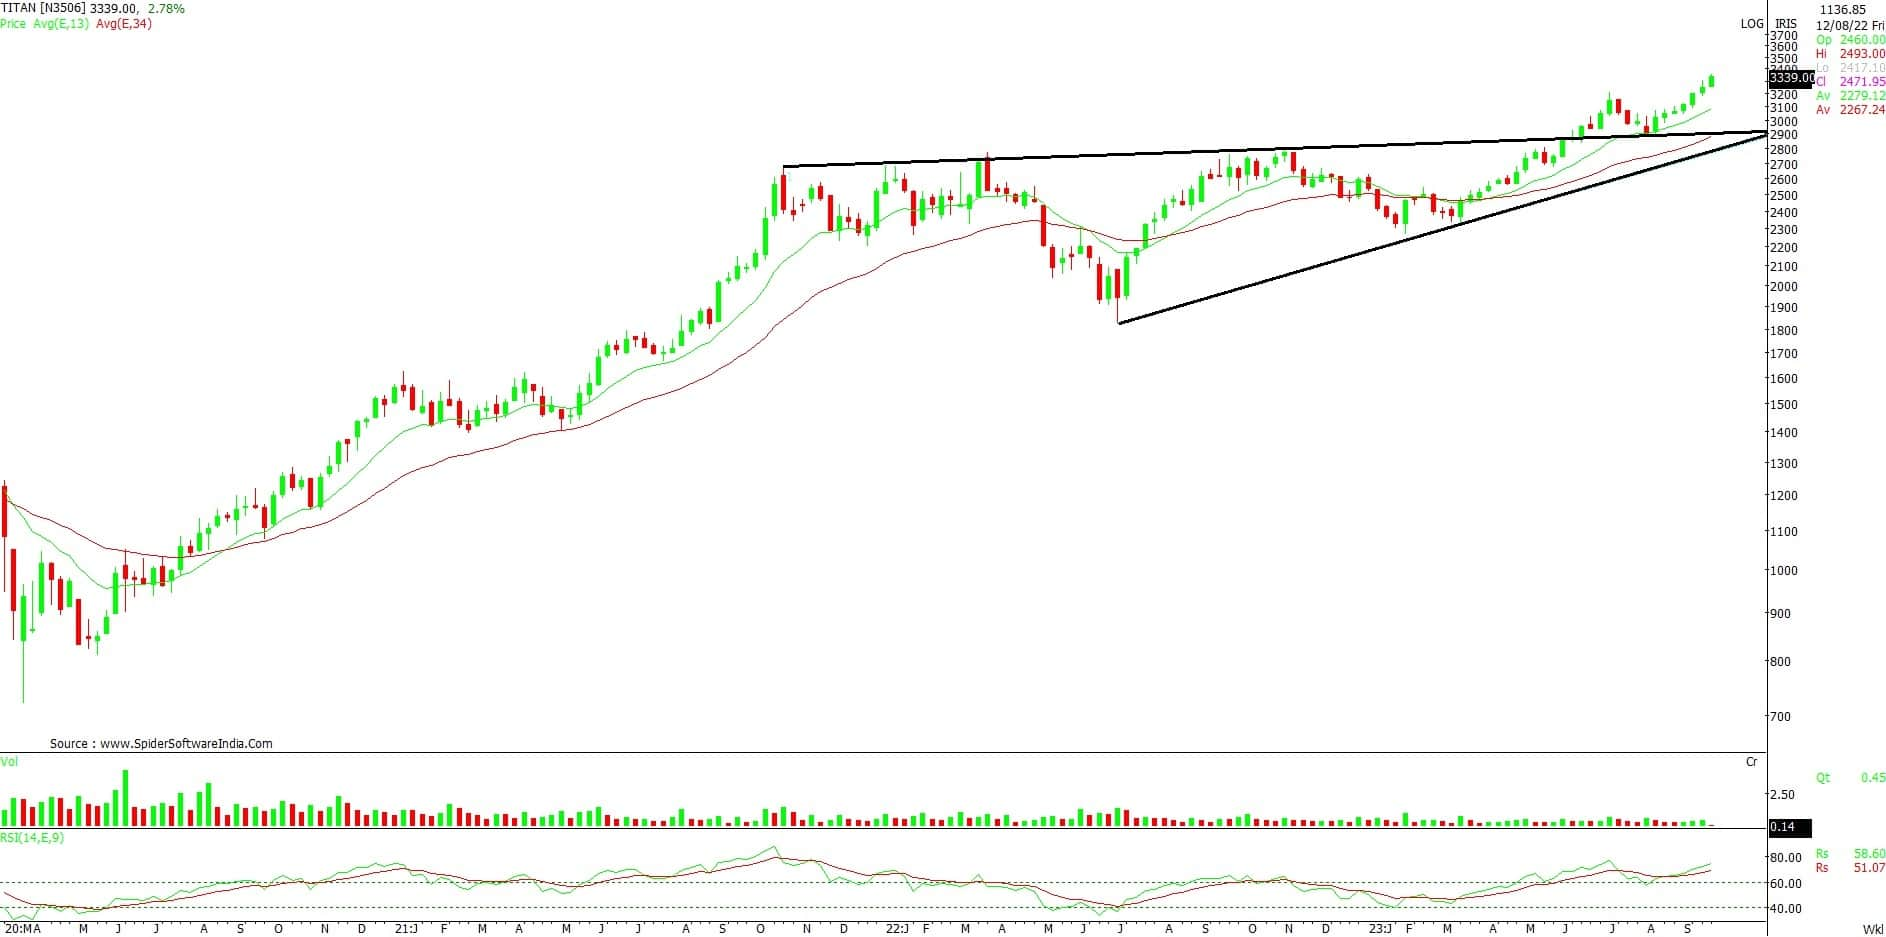
Stocks that outperformed broader markets included Titan Company, Punjab National Bank and Asahi India. Titan Company hit a fresh high on September 18 and ended with 2.8 percent gains at a new closing high of Rs 3,339.50 on the NSE. The stock has formed a long bullish candlestick pattern on the daily charts with strong volumes, while there was an upward sloping resistance trendline adjoining highs of July 7 and September 14.
Punjab National Bank hit a multi-year high of Rs 79.05 and closed 3.7 percent higher at Rs 76.90 with healthy volumes, forming a bullish candlestick pattern with a long upper shadow on the daily charts. The stock gained for four days in a row while staying above all key moving averages, which is a positive sign.
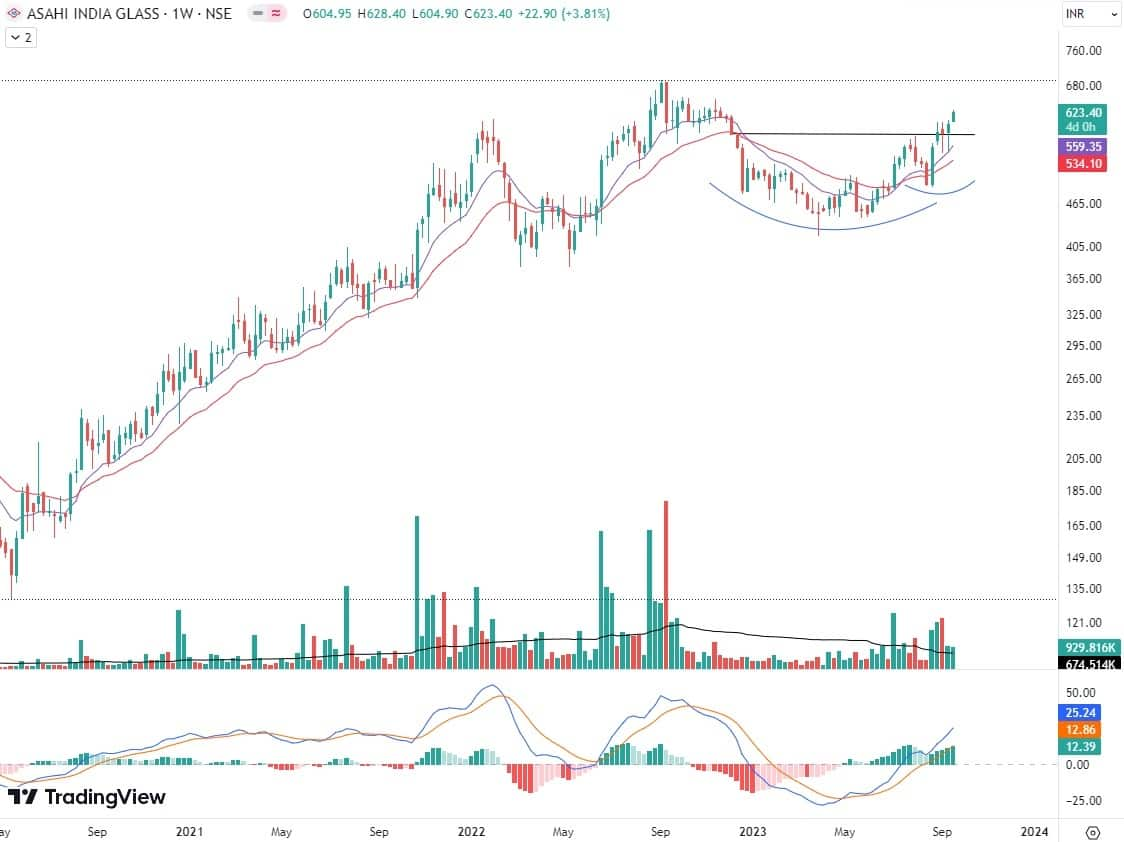
Asahi India Glass has seen a good breakout of downward sloping resistance trendline with above-average volumes. Further, it has formed a long bullish candlestick pattern which resembles Three White Soldiers kind of pattern formation after taking support at around Rs 550. The stock rose 3.8 percent to Rs 623, with trading above all key moving averages.
Here’s what Vidnyan Sawant of GEPL Capital recommends investors should do with these stocks on Wednesday:
Titan Company
The stock recently hit its all-time high at Rs 3,352 and is currently maintaining these record levels, indicating a strong bullish sentiment for the medium to long term.
Upon analysing the weekly chart, we observed a breakout from an Ascending Triangle pattern in June 2023. Furthermore, the stock formed a Change in Polarity (CIP) pattern at the breakout level, providing additional confirmation of the positive outlook for the stock.
On the daily charts, we witnessed a breakout from a rounding pattern, which was accompanied by higher trading volume, signalling a significant upward movement.
In addition to these technical patterns, the relative strength index (RSI) momentum indicator remained consistently above the 65 level across all time frames—daily, weekly and monthly—demonstrating strong positive momentum.
We expect the stock price to continue its upward trajectory, potentially reaching Rs 3,675. To effectively manage risk, it is advisable to implement a stop-loss at Rs 3,170 on a closing basis.
Punjab National Bank
PNB has consistently exhibited a pattern of forming Higher Highs and Higher Lows, and this pattern is accompanied by a noticeable increase in trading volume. This suggests a significant accumulation of the stock, which is driving its prices higher.
In early July 2023, the stock successfully broke out of a Cup & Handle pattern on the weekly charts, indicating the beginning of an upward trajectory. Currently, the stock is trading above both the 12-week and 26-week exponential moving averages (EMA), further reinforcing its bullish trend.
In support of this positive outlook, the RSI is steadily trending upwards and consistently maintaining a level above 65, underscoring the ongoing upward momentum.
Looking ahead, we expect the stock price to continue its ascent, potentially reaching a target of Rs 98. To effectively manage risk, it is advisable to set a stop-loss at Rs 66 on a closing basis.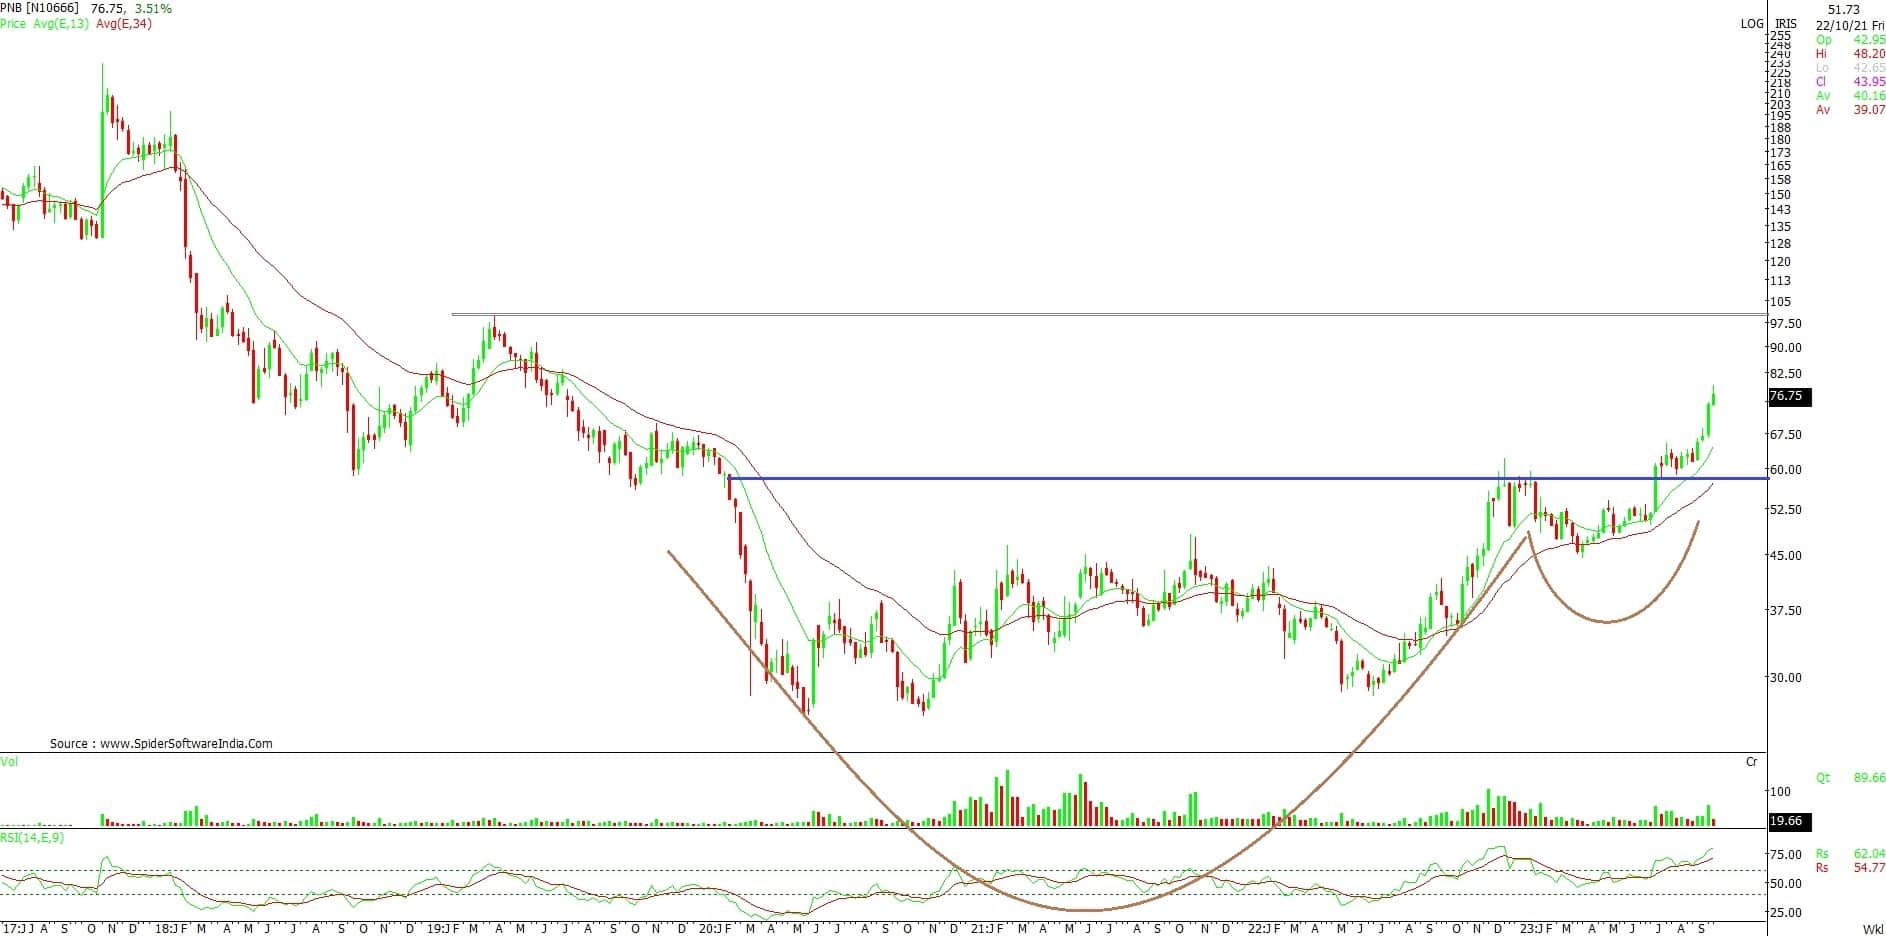
Asahi India Glass
The stock has experienced a graceful correction, notably avoiding patterns of Lower Highs and lower Lows, which emphasises a generally positive sentiment in its price movement.
The stock showed a breakout from the Cup & Handle pattern during the latest trading session, signalling the onset of an upward trend. This ascent has been bolstered by the support from the 12 & 26-week exponential moving average, reaffirming the presence of an uptrend.
Furthermore, the MACD (moving average convergence divergence) on the weekly charts remains elevated and consistently above the zero line, indicating a continued increase in momentum. We recommend traders and investors buy this stock further for the target of Rs 692 with the stop-loss being Rs 589 on the closing basis.