Candlestick patterns are one of the most powerful trading concepts, they are simple, easy to identify, and very profitable setups, a research has confirmed that candlestick patterns have a high predictive value and can produce positive results.
I personally trade candlestick pattern for more than 20 years; i can’t really switch to another method, because i tried thousands of strategies and trading methods with no results.
If you know how to read candlestick patterns the right way, you will be able to understand what these patterns tell you about the market dynamics and the trader’s behavior.
This skill will help you better enter and exit the market in the right time.
In other words, this will help you act differently in the market and make money following the smart guy’s footprints.
The candlestick patterns that i’m going to show you here are the most important patterns that you will find in the market, in this chapter, i’m not going to show you how to trade them, because this will be explained in details in the next chapters.
If you can get this skill, you will be ready to understand and master the trading strategies and tactics that i’m going to teach you in the next chapters.
The engulfing bar candlestick pattern
The Engulfing bar as it states in its title is formed when it fully engulfs the previous candle. The engulfing bar can engulf more than one previous candle, but to be considered an engulfing bar, at least one candle must be fully consumed.
The bearish engulfing is one of the most important candlestick patterns.
This candlestick pattern consists of two bodies:
The first body is smaller than the second one, in other words, the second body engulfs the previous one. See the illustration below:
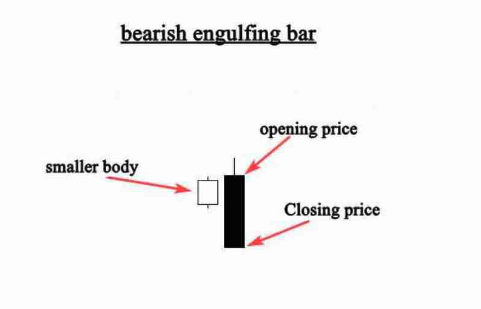
This is how a bearish engulfing bar pattern looks like on your charts, this candlestick pattern gives us valuable information about bulls and bears in the market.
In case of a bearish engulfing bar, this pattern tells us that sellers are in control of the market.
When this pattern occurs at the end of an uptrend, this indicates that buyers are engulfed by sellers which signals a trend reversal.
See the example below:
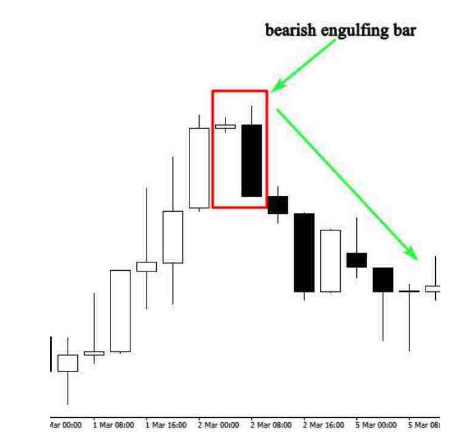
As you can see when this price action pattern occurs in an uptrend, we can anticipate a trend reversal because buyers are not still in control of the market, and sellers are trying to push the market to go down.
You can’t trade any bearish candlestick pattern you find on your chart; you will need other technical tools to confirm your entries.
We will talk about this in details in the next chapters. Right now, i just want you to open your charts and try to identify all bearish candlestick patterns that you find.
The bullish engulfing bar pattern
The bullish engulfing bar consists of two candlesticks, the first one is the small body, and the second is the engulfing candle, see the illustration:
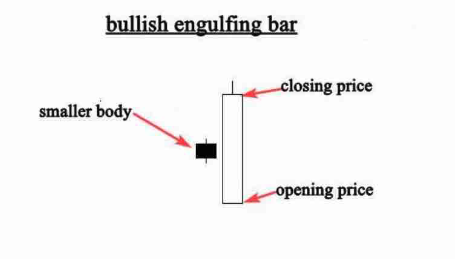
The bullish engulfing bar pattern tells us that the market is no longer under control of sellers, and buyers will take control of the market.
When a bullish engulfing candle forms in the context of an uptrend, it indicates a continuation signal.
When a bullish engulfing candle forms at the end of a downtrend, the reversal is much more powerful as it represents a capitulation bottom.
See the example below:
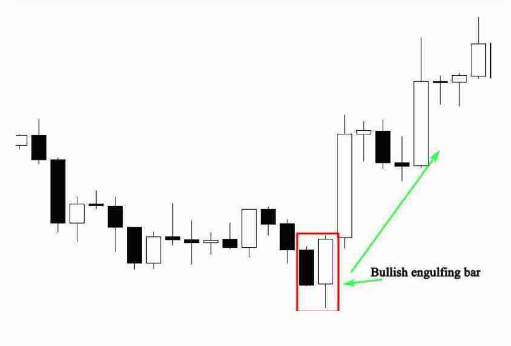
The example above shows us clearly how the market changes direction after the formation of a bullish engulfing bar pattern.
The smaller body that represents the selling power was covered by the second body that represents the buying power.
The color of the bodies is not important. What’s important is that the smaller one is totally engulfed by the second candlestick.
Don’t try to trade the market using this price action setup alone, because you will need other factors of confluence to decide whether the pattern is worth trading or not, i will talk about this in the next chapters.
What i want you to do now is to get the skill of identifying bearish and bullish engulfing bar on your charts. This is the most important step for the moment.
The Doji Candlestick pattern
Doji is one of the most important Japanese candlestick patterns, when this candlestick forms, it tells us that the market opens and closes at the same price which means that there is equality and indecision between buyers and sellers, there is no one in control of the market.
See the example below:
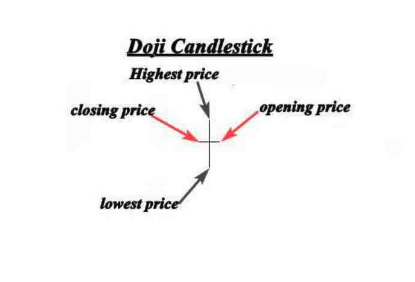
As you can see the opening price is the same as the closing price, this signal means that the market didn’t decide which direction will take.
When this pattern occurs in an uptrend or a downtrend, it indicates that the market is likely to reverse.
See another example below to learn more:
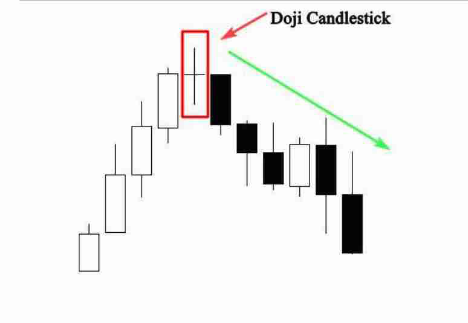
The chart above shows how the market changed direction after the formation of the Doji candlestick.
The market was trending up, that means that buyers were in control of the market.
The formation of the Doji candlestick indicates that buyers are unable to keep price higher, and sellers push prices back to the opening price.
This is a clear indication that a trend reversal is likely to happen.
Remember always that a Doji indicates equality and indecision in the market, you will often find it during periods of resting after big moves higher or lower.
When it is found at the bottom or at the top of a trend, it is considered as a sign that a prior trend is losing its strengths.
So if you are already riding that trend it’s time to take profits, it can also be used as an entry signal if it is combined with other technical analysis
The Dragonfly Doji pattern
The Dragonfly Do is a bullish candlestick pattern which is formed when the open high and close are the same or about the same price.
What characterizes the dragonfly Doji is the long lower tail that shows the resistance of buyers and their attempt to push the market up.
See the example below:
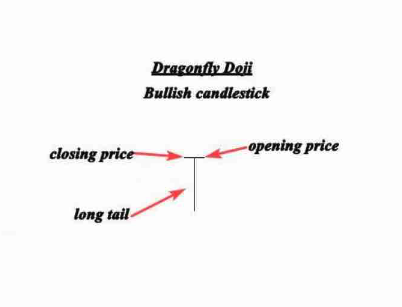
The illustration above shows us a prefect dragonfly Doji. The long lower tail suggests that the forces of supply and demand are nearing a balance and that the direction of the trend may be nearing a major turning point.
See the example below that indicates a bullish reversal signal created by a dragonfly Doji.
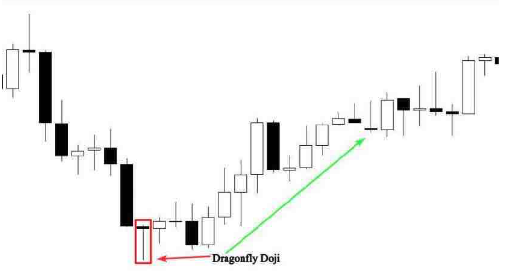
In the chart above, the market was testing the previous support level that caused a strong rejection from this area.
The formation of the dragonfly Doji with the long lower tail shows us that there is a high buying pressure in the area.
If you can identify this candlestick pattern on your chart, it will help you visually see when support and demand are located.
When it occurs in a downtrend, it is interpreted as a bullish reversal signal.
But as i always say, you can’t trade candlestick pattern alone, you will need other indicators and tools to determine high probability dragonfly Doji signals in the market.
The Gravestone Doji
The Gravestone Doji is the bearish version of the dragonfly Doji, it is formed when the open and close are the same or about the same price.
What differentiates the Gravestone Doji from the dragonfly Doji is the long upper tail.
The formation of the long upper tail is an indication that the market is testing a powerful supply or resistance area.
See the example below:
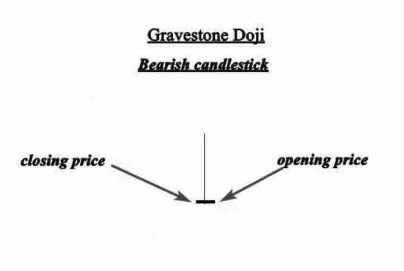
The image above illustrates a perfect gravestone Doji. This pattern indicates that while buyers were able to push prices well above the open.
Later in the day sellers overwhelmed the market pushing the price back down.
This is interpreted as a sign that bulls are losing their momentum and the market is ready for a reversal.
See another illustration below:
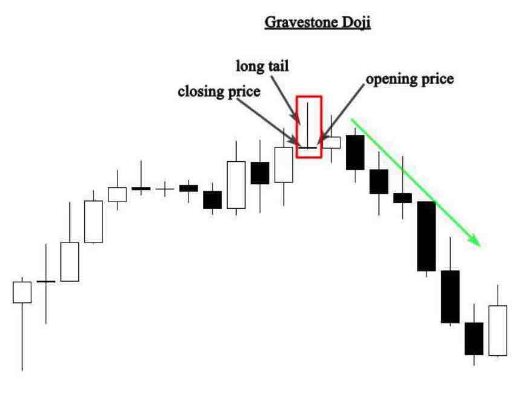
The chart above shows a gravestone Doji at the top of an uptrend, after a period of strong bullish activity.
The formation of this candlestick pattern indicates that buyers are no longer in control of the market. For this pattern to be reliable, it must occur near a resistance level.
As a trader, you will need additional information about the placement and context of the gravestone Doji to interpret the signal effectively.
This is what i will teach you in the next chapters.
The morning star
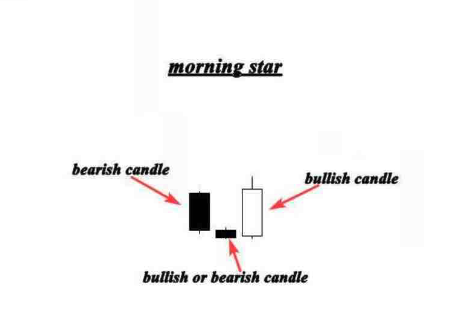
The morning star pattern is considered as a bullish reversal pattern, it often occurs at the bottom of a downtrend and it consists of three candlesticks:
- The first candlestick is bearish which indicates that sellers are still in charge of the market.
- The second candle is a small one which represents that sellers are in control, but they don’t push the market much lower and this candle can be bullish or bearish.
- The third candle is a bullish candlestick that gapped up on the open and closed above the midpoint of the body of the first day, this candlestick holds a significant trend reversal signal.
The morning star pattern shows us how buyers took control of the market from sellers, when this pattern occurs at the bottom of downtrend near a support level, it is interpreted as a powerful trend reversal signal.
See the illustration below:
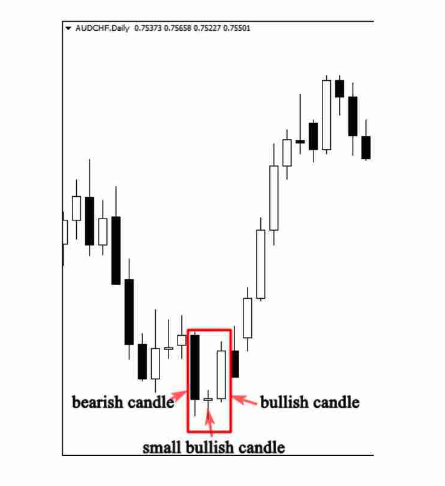
The chart above helps us identify the morning star pattern and how it is significant when it is formed at the bottom of a downtrend.
As you can see the pattern occurred at an obvious bearish trend.
The first candle confirmed the seller’s domination, and the second one produces indecision in the market, the second candle could be a Doji, or any other candle.
But here, the Doji candle indicated that sellers are struggling to push the market lower. The third bullish candle indicates that buyers took control from sellers, and the market is likely to reverse.
This is how professional traders analyze the market based on candlestick patterns, and this is how you will analyze financial markets if you can master the anatomy of candlestick patterns and the psychology behind their formations.
The evening star pattern
The evening star pattern is considered as a bearish reversal pattern that usually occurs at the top of an uptrend.
The pattern consists of three candlesticks:
- The first candle is a bullish candle
- The second candle is a small candlestick, it can be bullish or bearish or it can be a Doji or any other candlestick.
- The third candle is a large bearish candle. In general, the evening star pattern is the bearish version of the morning star pattern. See the example below:
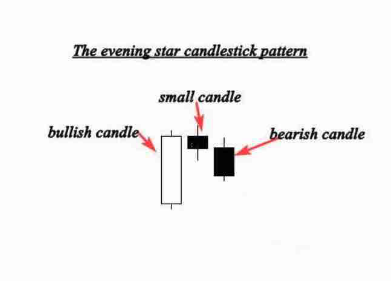
The first part of an evening star is a bullish candle; this means that bulls are still pushing the market higher.
Right now, everything is going all right. The formation of the smaller body shows that buyers are still in control but they are not as powerful as they were.
The third bearish candle indicates that the buyer’s domination is over, and a possible bearish trend reversal is likely to happen.
See another chart that illustrates how the evening star could represent a significant trend reversal signal.
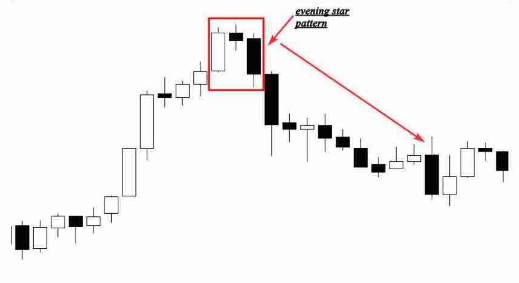
As you can see the market was trending up, the first candle in the pattern indicates a long move up.
The second one is a short candle indicating price consolidation and indecision.
In other words, the trend that created the first long bullish candlestick is losing momentum. The final candlestick gaping lower than the previous candlestick indicating a confirmation of the reversal and the beginning of a new trend down.
The Hammer (pin bar)
The Hammer candlestick is created when the open high and close are roughly the same price; it is also characterized by a long lower shadow that indicates a bullish rejection from buyers and their intention to push the market higher.
See the illustration below to see how it looks like:
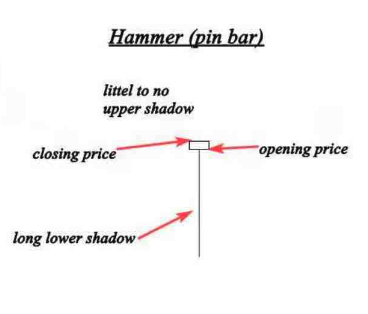
The hammer is a reversal candlestick pattern when it occurs at the bottom of a downtrend.
This candle forms when sellers push the market lower after the open, but they get rejected by buyers so the market closes higher than the lowest price.
See another example below:
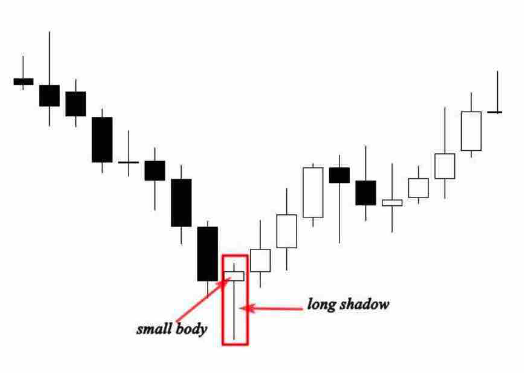
As you can see the market was trending down, the formation of the hammer (pin bar) was a significant reversal pattern.
The long shadow represents the high buying pressure from this point.
Sellers was trying to push the market lower, but in that level the buying power was more powerful than the selling pressure which results in a trend reversal.
The most important to understand is the psychology behind the formation of this pattern, if you can understand how and why it was created, you will be able to predict the market direction with high accuracy.
We will talk about how to trade this pattern and how to filter this signal in the next chapters.
The shooting star (bearish pin bar)
The shooting formation is formed when the open low, and close are roughly the same price, this candle is characterized by a small body and a long upper shadow. It is the bearish version of the hammer.
Professional technicians say that the shadow should be twice the length of the real body.
See the example below:
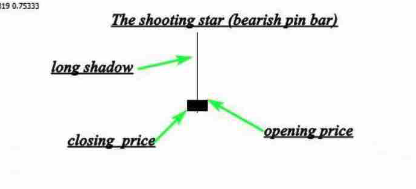
The illustration above shows us a perfect shooting star with a real small body and an upper long shadow, when this pattern occurs in an uptrend; it indicates a bearish reversal signal.
The psychology behind the formation of this pattern is that buyers try to push the market higher, but they got rejected by a selling pressure.
When this candlestick forms near a resistance level. It should be taken as a high probability setup.
See another example below:
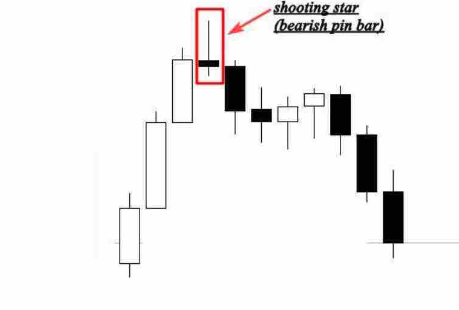
The chart above shows a nice shooting star at the end of an uptrend.
The formation of this pattern indicates the end of the uptrend move, and the beginning of a new downtrend.
This candlestick pattern can be used with support and resistance, supply and demand areas, and with technical indicators.
The shooting star is very easy to identify, and it is very profitable, it is one of the most powerful signals that i use to enter the market.
In the next chapters, i will talk about it in details, and i will show you step by step how to make money trading this price action pattern.
The Harami Pattern (the inside bar)
The Harami pattern (pregnant in Japanese) is considered as a reversal and continuation pattern, and it consists of two candlesticks:
The first candle is the large candle, it is called the mother candle, followed by a smaller candle which is called the baby.
For the Harami pattern to be valid, the second candle should close outside the previous one.
This candlestick is considered as a bearish reversal signal when it occurs at the top of an uptrend, and it is a bullish signal when it occurs at the bottom of a downtrend.
See an example below:

As you see the smaller body is totally covered by the previous mother candle, don’t bother yourself with the colors, the most important is that the smaller body closes inside of the first bigger candle.
The Harami candle tells us that the market is in an indecision period.
In other words, the market is consolidating.
So, buyers and sellers don’t know what to do, and there is no one in control of the market.
When this candlestick pattern happens during an uptrend or a downtrend, it is interpreted as a continuation pattern which gives a good opportunity to join the trend.
And if it is occurred at the top of an uptrend or at the bottom of a downtrend, it is considered as a trend reversal signal.
Look at another example below:
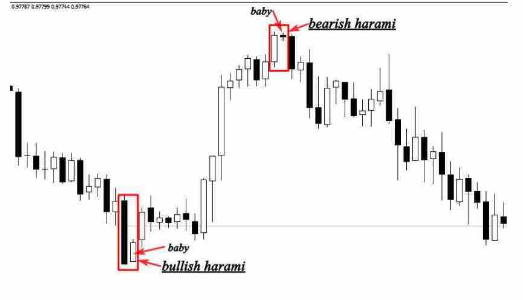
In the chart above, you can see how the trend direction changes after the Haram pattern formation, the first bullish harami pattern occurred at the bottom of a downtrend, sellers were pushing the market lower, suddenly price starts consolidating, and this indicates that the selling power is no longer in control of the market.
The bearish Harami is the opposite of the bullish, this one occurred at the top of an uptrend indicating that buyer’s domination is over and the beginning of a downtrend is possible.
When this pattern is created during an uptrend or a downtrend, it indicates a continuation signal with the direction of the market.
We will study in details how to trade this pattern either as a reversal pattern or as a continuation pattern in the next chapters.
The Tweezers tops and bottoms
The tweezers top formation is considered as a bearish reversal pattern seen at the top of an uptrend, and the tweezers bottom formation is interpreted as a bullish reversal pattern seen at the bottom of a downtrend.
See the example below:
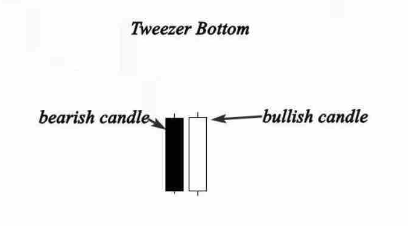
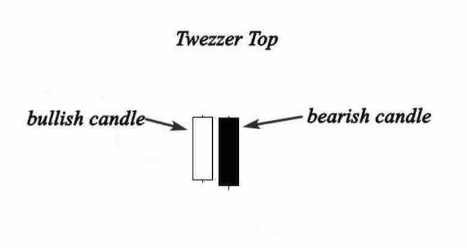
The tweezers top formation consists of two candlesticks:
The first one is a bullish candlestick followed by a bearish candlestick.
And the tweezers bottom formation consists of two candlesticks as well.
The first candle is bearish followed by a bullish candlestick.
So we can say that the tweezers bottom is the bullish version of the tweezers top.
The tweezers top occurs during an uptrend when buyers push the price higher, this gave us the impression that the market is still going up, but sellers surprised buyers by pushing the market lower and close down the open of the bullish candle.
This price action pattern indicates a bullish trend reversal and we can trade it if we can combine this signal with other technical tools.
The tweezers bottom happens during a downtrend, when sellers push the market lower, we feel that everything is going all right, but the next session price closes above or roughly at the same price of the first bearish candle which indicates that buyers are coming to reverse the market direction.
If this price action happens near a support level, it indicates that a bearish reversal is likely to happen.
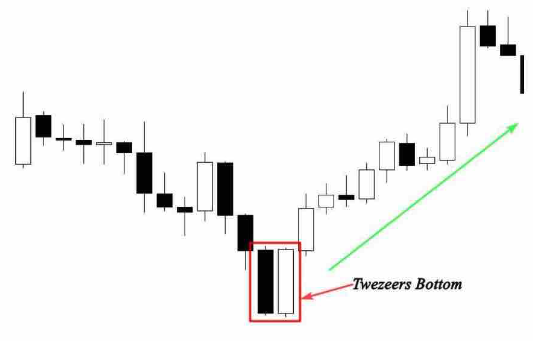
The chart above shows us a tweezers bottom that occurs in a downtrend, the bears pushed the market downward on the first session; however, the second session opened where prices closed on the first session and went straight up indicating a reversal buy signal that you can trade if you have other elements that confirm your buying decision.
Don’t focus on the name of a candlestick, try to understand the psychology behind its formation, this is the most important.
Because if you can understand why it was formed, you will understand what happened in the market, and you can easily predict the future movement of price.
Itís hard to find well-informed people for this topic, however, you seem like you know what youíre talking about! Thanks
דירות דיסקרטיות בראשון לציון